The third step in creating a Report Generator report is to enter the columns of the report. Every report requires columns, cells, and rows to be defined in order to create a report grid to place the actual data to be shown on the report.
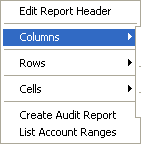
Right click anywhere in the design portion of the report grid to access the report design pop-up menu.
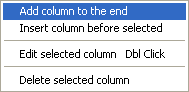
Depending upon where you would like to add the column, select either Add column to the end or Insert column before selected. Either option will produce the Report Column Design dialog.
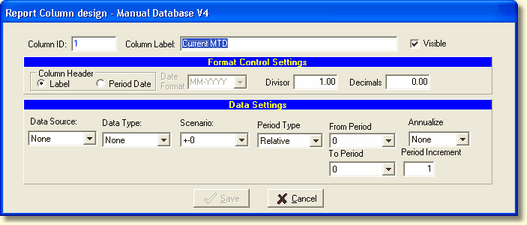
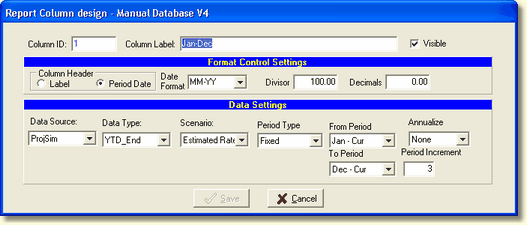
Column ID
The column ID is an internal number used by the system to identify the column. It is a read-only value and cannot be changed.
Column Label
The column label is the user defined column header. It is passed to Crystal Reports® as an available column heading.
Visible
If you want this column to appear on the report, check this box.
Format Control Settings
Column Header
There are two options for the column heading, use the column label or the selected period date format.
Date Format
When the Period Date column header is selected, choose the appropriate date format from several month/year formats.
Divisor
The divisor is used to format the data in the column. For example, to display data in thousands enter 1000.
Decimals
To change the decimal position of the data enter the appropriate decimal places.
Format settings in the Cell will override the same data formats in the Column. Unless the Cell option, Reset Cell(s) to Column Default, is taken. See Cells for more information.
If the Column setting for Divisor/Decimals should be the default, make sure the Cell settings are "None" not zero.
Data Settings
See Data Definition for a detailed description of the Data Settings.
NOTE: It is recommended where ever possible, if the cells in each row will contain the same data definitions, to set these definitions in the Column settings and set the cell definitions to None.
In our example below we will retrieve the Year End Value for January through Dec of the current year, displaying data quarterly. This value will stay constant as the capture period moves forward.