![]() Main Menu | Reporting | My Reports | Select Report Generator Report (Edit)
Main Menu | Reporting | My Reports | Select Report Generator Report (Edit)
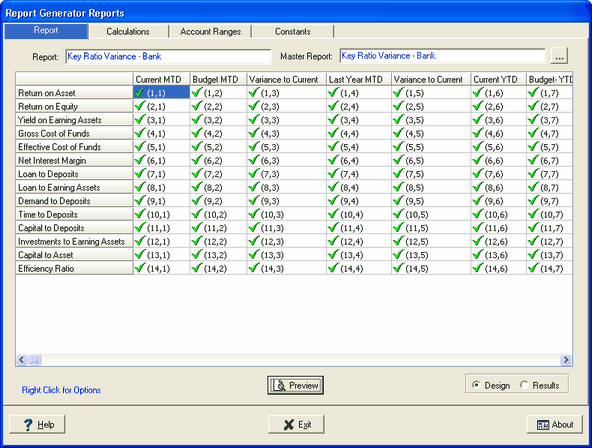
Once the report is created from one of the Master Reports Report Generator templates, the designing process can start by editing the report in My Reports tab.
The actual report design is accomplished via a grid of columns, rows and cells. Cells can be filled with any component or you can create results by performing calculations between different cells.
Icons in Cells
There are 3 types of icons represented on the report grid as shown in the example below.
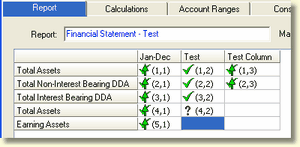
![]() These cells use the data definitions defined in the cell set up. Data definitions in the cell settings will override the data definitions in the column settings.
These cells use the data definitions defined in the cell set up. Data definitions in the cell settings will override the data definitions in the column settings.
![]() These cells use the data definitions defined in the column set up.
These cells use the data definitions defined in the column set up.
![]() These cells are missing data definitions settings in the cell and will need to be set up.
These cells are missing data definitions settings in the cell and will need to be set up.
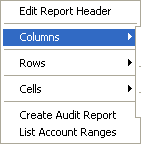
All report design functions are accessed from a pop-up menu by right clicking any where on the report grid. The pop-up menu is shown below.
By default the report will be in design mode, as indicated by the radio button in the lower right corner, showing the cell descriptions. Once a report has been designed, or even while it is being designed, the display can be switched to result mode.
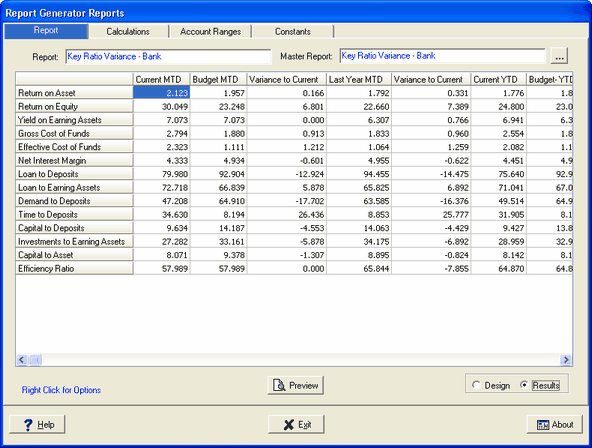
In this mode, the report will show the resulting value for each cell, effectively displaying the final report in raw format.