Data Definition Options
Data definitions are the options which define the specific data to be used in the cell, formula, calculation and column definitions. Each definition is comprised of 5 components: SOURCE, TYPE, SCENARIO, PERIOD, and ANNUALIZE. Each component has multiple options.
The None option for each component can be used in Column definitions where the components will vary in the selected column within the report. None in Data Definitions will allow the column settings to take priority for the definition.
SOURCE
The Source component identifies the general source of the data. In the model, we have actual historical data, shock projections, simulation projections, EVE results and budget set data.
SOURCE OPTIONS |
DEFINITION & USE |
None |
|
ProjShk |
Data is from the Adv Income Shock data |
ProjSim |
Data is from the Budget simulation data |
Budget |
Data is from the default budget set |
EVE |
Data is from EVE shock data |
Note that when a historical period is defined, actual historical data will be displayed when ProjShk or ProjSim source is selected.
TYPE
The Type component identifies the option of balances or yields results for the source data.
TYPE OPTIONS |
DEFINITION & USE |
None |
|
MTD_End |
Uses ending balances for the defined period’s month to date data balance |
MTD_Avg |
Uses average balances for the defined period’s month to date data balance |
QTD_End |
Uses ending balances for the defined period’s quarter to date data balance |
QTD_Avg |
Uses average balances for the defined period’s quarter to date data balance |
YTD_End |
Uses ending balances for the defined period’s year to date data balance |
YTD_Avg |
Uses average balances for the defined period’s year to date data balance |
Prj_End |
Uses the projected ending balance at the defined period date for the data. Example of this is with the IRR Summary report where the income calculations are rolling 12 month projection |
Prj_Avg |
Uses the projected average balance at the defined period date for the data. |
MTD_Yield |
Uses the account or range of accounts (Balance Sheet accounts)and displays the month to date yield for the defined period |
YTD_Yield |
Uses the account or range of accounts (Balance Sheet accounts) and displays a year to date yield for the defined period. |
MTD_End_Act |
Same as MTD_End data. Used to display results in projection periods as zero |
MTD_Avg_Act |
Same as MTD_Avg data. Used to display results in projection periods as zero |
YTD_End_Act |
Same as YTD_End data. Used to display results in projection periods as zero |
YTD_Avg_Act |
Same as YTD_Avg data. Used to display results in projection periods as zero |
MTD_Yield_Act |
Same as MTD_Yield data. Used to display results in projection periods as zero |
YTD_Yield_Act |
Same as YTD_Yield data. Used to display results in projection periods as zero |
Runoff |
|
RunoffChg |
|
Reinvest |
|
ReinvestChg |
|
MTD_Inc |
|
YTD_Inc |
|
NPV |
|
EVE_CurBal |
|
SCENARIO
Scenario component identifies the data is being derived from either shock scenarios or budget simulations. Scenario is dependent on the SOURCE.
SOURCE OPTIONS |
SCENARIO OPTION |
DEFINITION & USE |
None, ProjShk, EVE |
7 Shock Scenarios, as defined in the model |
Defines which of the 7 shock scenarios is used for the data; typically the options are +300, +200, +100, +-0, -100, -200, and -300 |
ProjSim |
Any budget simulation setup in the model(up to 7) |
Uses the Budgeting module’s selected simulation data (which changes with each monthly download)
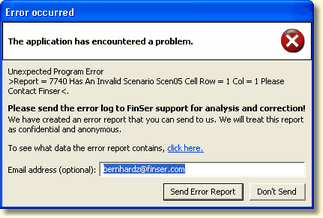
If a report uses a Budget simulation which has been deactivated, the system will create an error message informing the user of the location of the cell using the deactivated Budget simulation as shown below.
|
Budget |
N/A |
The default budget set’s data will be used and scenario is not necessary. Budget data is static and does not change unless the budget set is resaved |
PERIOD
The Period component is used to define the specific timeframe to be reported.
PERIOD OPTIONS |
DEFINITION & USE |
None |
Can be used when EVE data is the Source as EVE data is always the current period data, no matter what period is defined |
Relative |
Defines the date of the data in relation to the current processing period. (i.e. -12 equals a year ago, 9 equals 9 months in the future) Valid data can be obtained from -12 to +24 |
Fixed |
Defines the specific date of the data by calendar month. Options include None Jan through Dec –Cur (Selected month in current calendar year) Jan through Dec – Next (selected month in next calendar year) |
Range Rel.* |
Used in column definitions to define and create multiple columns in a report representing a range of periods (relative to the current processing month, -12 to +24) for determining the data used |
Range Fix.* |
Used in column definitions to define and create multiple columns in the report representing a range of periods (using calendar months) for determining the data used. Uses same options as Period option “FIXED” |
*With Range Rel and Range Fix., both a “From Period” and “To Period” need to be defined, along with the Period Increments (number of consecutive periods representing the columns to be created).
ANNUALIZE
The Annualize option is used in formulas and calculations where the component of the formula requires annualization, such as in yield ratios.
ANNUALIZE OPTION |
DEFINITION & USE |
None |
|
Actual Actual |
Uses the actual number of days in the defined month and defined year to annualize the data |
Actual 360 |
Uses the actual number of days in the defined month and 360 for the number of days in the year to annualize the data |
30 / 360 |
Uses 30 days as the number of days in the defined month and 360 for the number of days in the year to annualize the data |
PERIOD INCREMENT
This Data Definition option is used in the Report Column Design screen. The Period Increment option is used in conjunction with the Period options; Range Rel.* and Range Fix.*. What will be the monthly increment from one column to the next? 1 represents monthly, 3 represents quarterly, 6 represents semi-annually, etc.