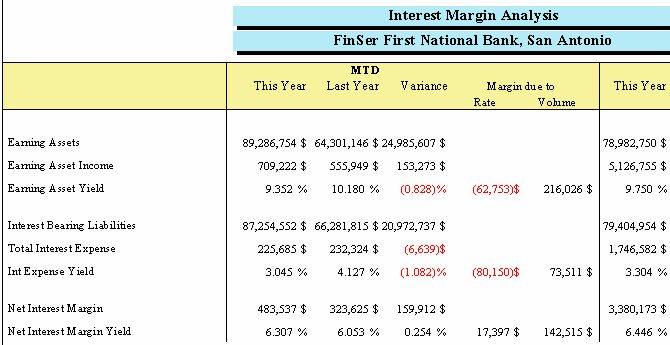
The Interest Margin Analysis report for Shock and Budget Simulation evaluates changes in net interest margin from last year due to changes in rate versus changes in volume. This provides a very useful analysis to the underlying nature of your interest margin change.
The breakdown of each column item will be explained below:
This Year/Last Year - The period definition for these two columns are set up in the Report Column Design screen. For This Year the relative period is set at 0. Last Year's relative period is set at -12.
Variance - The variance is simply This Year minus Last Year.
Margin due to / Rate & Volume - The best way to describe these two columns is to explain the above report.
Let's look at the Earning Assets section of the report.
This Year |
Last Year |
Variance |
Margin due to Rate |
Margin due to Volume |
|
Earning Assets |
MTD Avg. Bal.
89,286,754 |
MTD Avg. Bal.
64,301,146 |
This Year minus Last Year
24,985,607 |
There was growth of $24.9 million from the previous year in earning assets.
This Year |
Last Year |
Variance |
Margin due to Rate |
Margin due to Volume |
|
Earning Asset Income |
MTD Income
$709,222 |
MTD Income
$555,949 |
This Year minus Last Year
$153,273 |
There was growth of $153,273 from the previous year in earning asset income.
This Year |
Last Year |
Variance |
Margin due to Rate |
Margin due to Volume |
|
EA Yield |
This Year MTD Inc./31x365/ This Year Avg. Bal. x 100
709,222 / 31 x 365 / 89,286,754 x 100
9.352% |
Last Year MTD Inc./31x365/Last Year Avg. Bal. x 100
555,949 / 31 x 365 / 64,301,146 x 100
10.180% |
This Year Yield minus Last Year Yield
9.352% - 10.180
(0.828)% |
This Year Avg. Bal.x Yield Variance / 365 x 31.
89,286,754 x -.828 / 365 x 31
$(62,753) |
EA Income Variance minus the margin due to rate change.
153,273 - (62,753)
$216,026.05 |
There was a decrease in the earning asset yield of (0.828)% from the previous year because of rates going down. Even though there was an increase in earning assets from the previous year, you can see the yield was lower from the previous year because the decrease in rates. Therefore, the net income is not as high as you would think it should be. What percentage of the net interest margin was attributed to the rate change and what percentage was attributed to the increased volume? There was a decrease in the margin of $(62,753) due to a drop in rates, however, there was an increase in the margin of $216,026.05 due to the increased volume.
The same calculations are done in the liability side of the report.
This Year |
Last Year |
Variance |
Margin due to Rate |
Margin due to Volume |
|
Net Int. Margin |
This Year EA MTD Inc. minus This Year Int. Exp.
709,222 - 225,685
$483,537 |
Last Year EA MTD Inc. minus Last Year Int. Exp.
555,949 - 232,324
$323,625 |
This Year Net Int. Margin minus Last Year Net Int. Margin.
483,537 - 323,625
$159,912 |
||
Net Int. Margin Yield |
This Year EA MTD Yield minus This Year Int. Exp. Yield
9.352 - 3.045
6.307% |
Last Year EA MTD Yield minus This Year Int. Exp. Yield
10.180 - 4.127
6.053% |
This Year Net Int. Margin Yield minus Last Year Net Int. Margin Yield
6.307 - 6.053
.254% |
Margin change due to rate on asset side minus margin change due to rate on liability side.
(62,753) - (80,150)
$17,397 |
Margin change due to volume on asset side minus margin change due to volume on liability side.
216,026 - 73,511
$142,515 |
There is a difference of $159,912, in this year from last year, in the Net Interest Margin. $17,397 of that was due to a change in the rates, $142,515 is due to a change in the bank's volume.