The IRR Summary Report for Shock and Budget Simulation provides data in a 12 month time frame. It shows the following calculations for each of the seven shock scenarios as it compares to the bank's Income and Equity Policy Guidelines which are also shown on the report:
Net Interest Income (NII)
Net Interest Margin (NIM)
Return on Equity (ROE)
Economic Value of Equity
EVE - Adjusted Equity Ratio
Because this is a Report Generator report, it can be changed to fit a bank's particular requirements.
Below is an example of the IRR Summary Report.
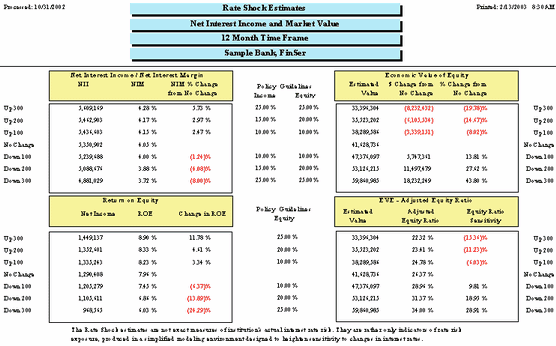
The left side of the report pertains to Net Interest Income. The right side refers to the EVE - Market Value.
The first section on the Net Interest Income side is shown below. This shows Net Interest Income, Net Interest Margin, and the Net Interest Margin percent change from the No Change scenario.
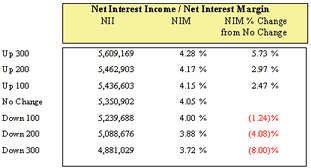
Net Interest Income (NII) -
Projected interest income subtracted from
Interest expense for a 12 month period.
Net Interest Margin -
Projected net interest income divided by
Average earning assets.
If you want to see the equation for the Net Interest Margin, click on the ratio: Net Interest Margin in Appendix A.
NIM % Change from No Change -
NIM % (selected scenario) subtracted from
NIM % (No Change) divided by
NIM % (No Change) multiplied by 100
For each scenario
The second section on the Net Interest Income side is shown below. This is your Return on Equity for each scenario and the change in ROE.
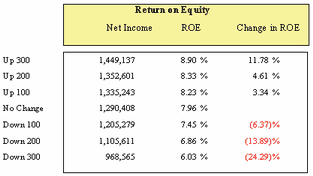
Net Income -
Projected income subtracted from
Expense for a 12 month period.
Return on Equity -
Projected Net Income divided by
Total Average Capital multiplied by 100
For each scenario
If you want to see the equation for the Net Interest Margin, click on the ratio: Return on Equity in Appendix A.
Change in ROE - Change in ROE from the No Change ROE.
ROE % (selected scenario) subtracted from
ROE % (No Change) divided by
ROE % (No Change) multiplied by 100.
For each scenario
The first section on the EVE - Market Value side is shown below. This shows Economic Value of Equity and the dollar and percent change from the No Change Scenario.
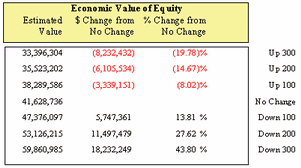
Estimated Value -
Net present value of Total Assets minus
Net present value of Total Liabilities.
In each of the scenarios.
$ Change from No Change -
Net present value (Estimated Value) subtracted from
Net present value (Estimated Value) in the No Change scenario.
In each of the scenarios.
% Change from No Change -
Net present $ change divided by
Estimated Value in the No Change scenario.
In each of the scenarios.
The second section on the EVE - Market Value side is shown below. This section displays the EVE - Adjusted Equity Ratio. It shows the estimated EVE value, adjusted Equity Ratio and Equity Ratio Sensitivity from the No Change Scenario.
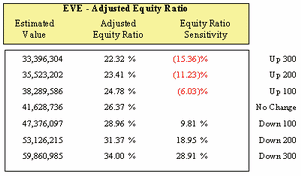
Estimated Value -
Net present value of Total Assets minus
Net present value of Total Liabilities
In each of the scenarios.
Adjusted Equity Ratio -
Net present value in No Change
(NPV Total Assets minus NPV Total Liabilities) divided by
Net present value Resulting Assets in No Change multiplied by 100
(Current Assets plus Net Present Value)
Equity Ratio Sensitivity -
Adjusted Equity Ratio (selected scenario) subtracted from
Adjusted Equity Ratio (No Change) divided by
Adjusted Equity Ratio (No Change) multiplied by 100