![]() Main Menu | Reporting | My Reports | Select Report (Gap group) and Edit
Main Menu | Reporting | My Reports | Select Report (Gap group) and Edit
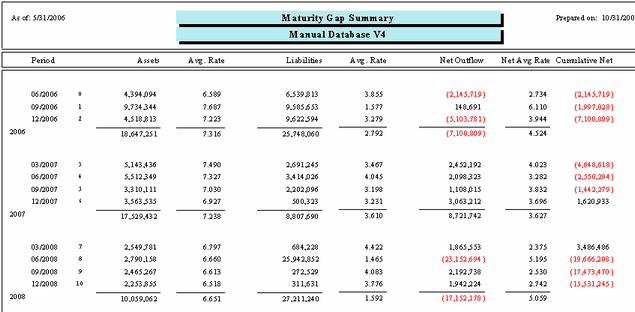
The Maturity Gap Summary report shows on a period by period basis, total repriceable assets versus total repriceable liabilities using just the maturity date. It also provides the net outflow and rate gap position between assets and liabilities as well as the cumulative net outflow.
The report can be printed by the timeframes: Monthly, Quarterly, Semi-Annually, Annually by changing Parameter 1-Sum Type in report edit mode. See Reporting/My Reports/Edit My Reports chapter for details on how to edit this report.
The Maturity Gap Summary report can be configured through their parameter selection to provide different views. The following screen displays the system parameters that can be customized by the bank.
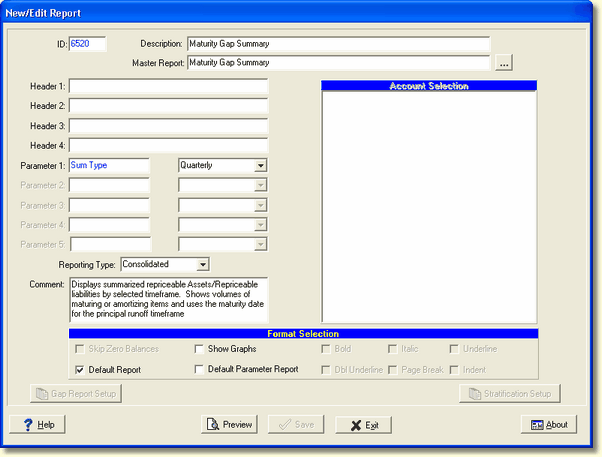
There is one system parameter for this report which can be changed by the user:
Parameter 1: SumType - Options are Monthly, Quarterly, Semi-Annually, and Annually. If you change this parameter, you may need to change the header to show the appropriate Time Frame you're using.
Calculations
Period - Timeframe option selected for the report (options are: Monthly, Quarterly, Semi-Annually, and Annually).
Re-Pricing Assets - Summation of all re-priceable interest earning assets in the given time period.
Rate - Average yield for re-priceable assets.
Re-Pricing Liabilities - Summation of all re-priceable interest bearing liabilities in the given time period.
Rate - Average yield for re-priceable liabilities.
Volume Gap - Re-pricing Assets minus Re-pricing Liabilities.
Mat Gap - Re-pricing Assets rate minus Re-pricing Liabilities rate.
Cum Volume Gap - A running total throughout the timeframes for the volume gap.