Plan Your Report in a Spreadsheet
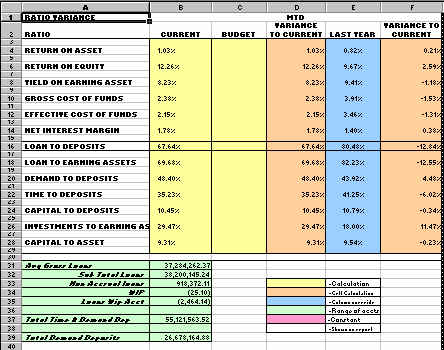
We start the process of setting up a new report by planning the layout in a spreadsheet. We determine the number of columns and rows (must fit in 13-column landscape or 9-column portrait format) we will need and color code the columns and rows based on our key in the lower right corner of the sample spreadsheet below.
First, let's explain the Key Ratio - Loans to Deposits
Loans to Deposits - Relates total loans, net of participations sold and deferred income, to total deposits. The higher the ratio, the lower the liquidity, thus it measures how much of the bank's deposits are being invested in loans or "non-liquid" assets.
Average Gross Loans, Net of Participations Sold
_________________________________________ x 100
Total Average Deposits
| 1. | Identify the range of accounts (green) that will be included in each side of the equation. |
| 2. | Enter the calculation (yellow) in the Current column in the spreadsheet in position B16 which will be B31/B37, do the same for the Budget column. |
| 3. | In the MTD Variance To Current (D16) column, a cell calculation (orange) will be used. This calculation is B16-C16. |
| 4. | The Last Year column is a column override (blue) which means the same calculations are used as was used in the Current column but for a different period. This column is not filled out because the column override is done in the report generator in IRR-Solutions® II not here in the spreadsheet. |
| 5. | The white area of the sample spreadsheet below is what will appear on the report. |
| 6. | The only constant (pink) used in this ratio will be "100". The final results will be multiplied by 100 to convert the result into a percentage which will position the decimal point in the right position. Like the blue area, the constant is done in the report generator in IRR-Solutions® II not here in the spreadsheet. |
Start the Report Setup Process in IRR-Solutions® II
![]() Main Menu | Reporting | My Reports
Main Menu | Reporting | My Reports
After the above path has been selected, the following screen is displayed:
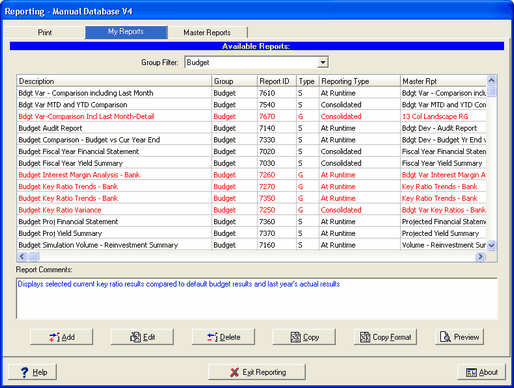
Add button - Press the Add button to add a new report. The following screen is displayed:
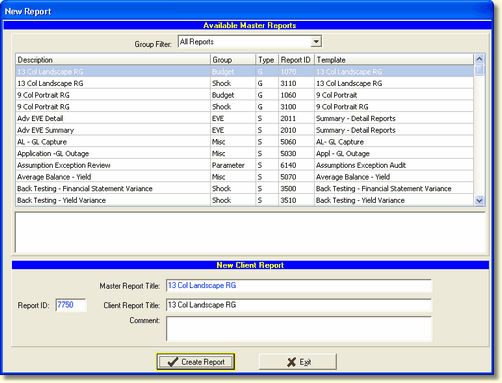
We will create a new report - 13 Col Landscape-RG from the available reports on which to base our new report. The Client Report Title will be filled in with the selected Master report. We can title it differently. We could also place any comment we wished in the comment box.
Make note of the Report ID number in the lower left corner and press Create Report and the system will bring us back to the My Reports tab.
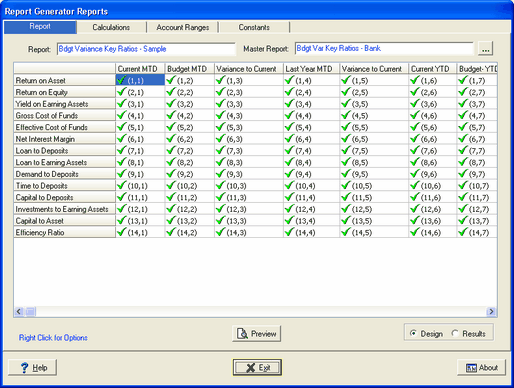
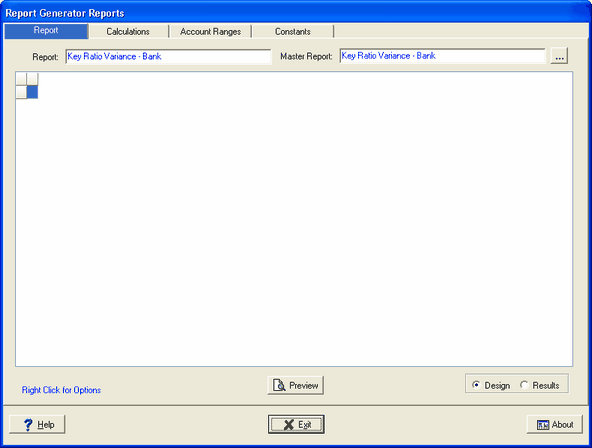
We will select the newly created report and press Edit and the following screen is displayed.
At this point we have only created a shell of our report. We will complete each tab (Calculations, Account Ranges, Constants), before the report itself is designed with rows and columns on the Report tab below.
To create a report from a pre-defined report template, select a Type "G" template other than the 9 or 13 Column templates. The Report tab screen will display all rows and columns as shown in the example below. Rows, Columns, and Cells can then be changed to suit the desired results.