Planning
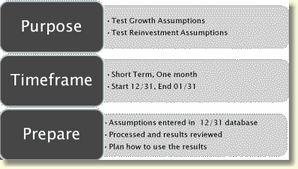
Let’s first plan. We decide we want to perform a Short–term Back test to Test the model’s Growth & Reinvestment assumptions.
We set a Starting date of 12/31. Our evaluation date will be the next month end processing date of 01/31.
Let’s get our tools ready: We enter /confirm our Advanced Income Shock assumptions in the 12/31 model (Growth, reinvestment, index rate, & prepayment) and process for results. We use the Comments field as we enter or update the assumptions to document our reasons/methodologies for using particular assumptions.
Determined that results will be used to refine the reinvestment and growth assumptions to be more realistic.
Create Back Test Set
Now let’s create our Back Test set.
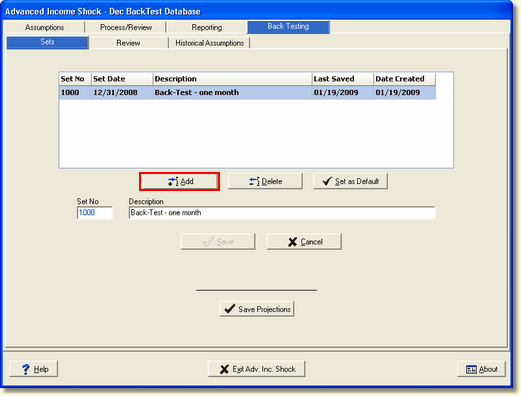
Go to the Back Testing tab in Advanced Income shock. You have 3 tabs within Back Testing; Sets, Review, and Historical Assumptions.
Using the Sets tab, click the Add button to create a new Back Test Set
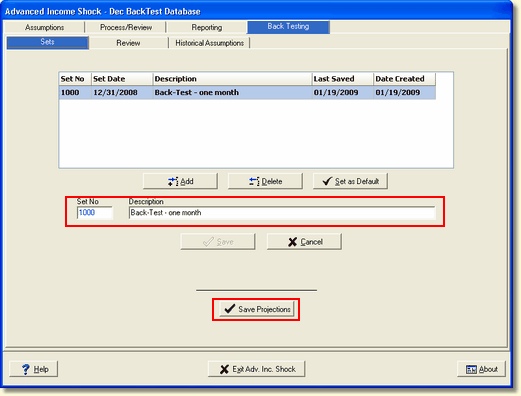
Give the Back test set a description that will easily identify it and click Save. The Set Date will be pre-filled once it is created. After establishing the set, click on Save Projections. This will save the results of Advanced Income Shock (volumes, yields, and assumptions) into the newly created set.
These Saved projections are stored into a unique separate file which will not be changed as future modifications are made in the model.
Log Events
Date |
Event |
1/1 |
Holiday |
1/5 |
Blizzard |
1/5 |
New Loan Officer Hired |
1/18 |
Stock Market Down |
1/20 |
New Branch of Competition Opens |
1/25 |
Announcement - Local Industry will Hire 150 More People |
1/30 |
End of CD Promotional Rate |
Now it’s time to start documenting. The Log prepared for events in January is updated. Be sure to log all events—even if you think events are insignificant at the time—still log it!
Review
With the end of the back test timeframe, you will Capture & Process for the Month as normal. Once the current month’s Advanced Income Shock module is processed, you will have comparison results available.
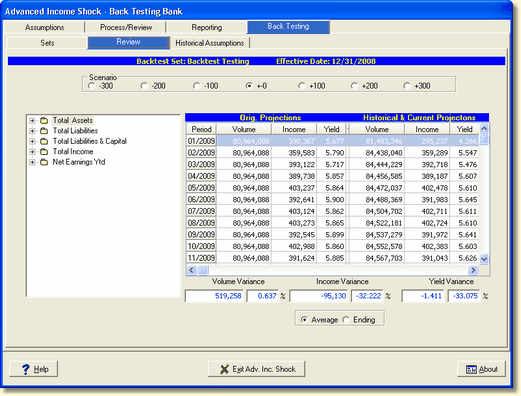
Click on the Review tab in Back Testing.
On this screen you can immediately see your volume variance and yield variance for the current month’s results to the back test.
You can also see “where you are going” with projections as they were for the projection periods versus what the model is now projecting as future results given the new updates (changes in loans, volumes, rates etc).
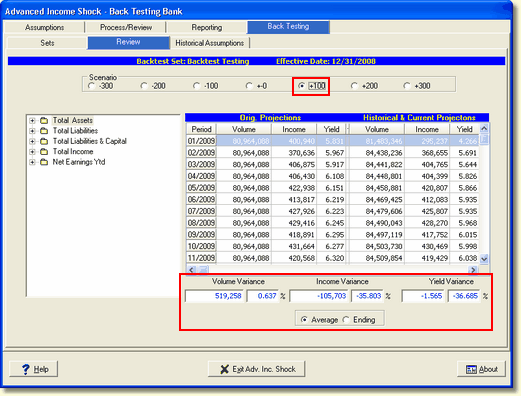
You can also see the shock scenario projections and compare. (Let’s pretend that the fed actually raised rates by 100 basis points. You can compare the Up 100 projections from the original to the actual results to see how accurate your projections were).
Analyze Results
Now that you have results, analysis is needed. The factors that affect your institution during the evaluation timeframe are varied and numerous. How you analyze your variances and causes will be dependent on your institution, but all comparisons can be made by looking at variances between the projections and the actual results.
IRR-Solutions® II provides the screens and reports to use for this comparison. Lets look at some of the items you may want to include in your evaluation.
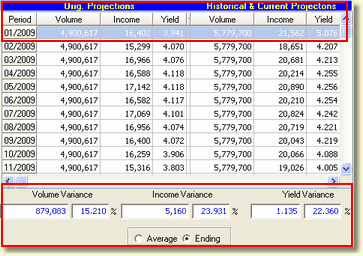
For example, Here is a Comparison on the Variable Real Estate Loans account.
With a quick glance, I can see that the actual ending balance for the month was 15.2 % higher than projected and the income on the actual volume were almost 24% higher than projected.
I’m already out performing the projections and may consider modifying the growth assumptions going forward and also look at the reinvestment rates in the model to determine how much they too should be modified to produce a more accurate projection of income.
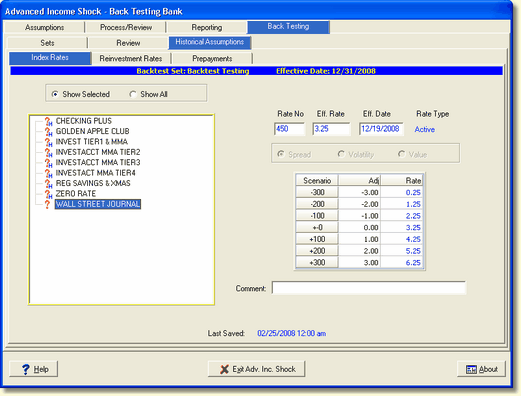
You can also look on screen to see the Index Rate, Reinvestment Rate, and Prepayments in effect at the time of the start of the test. Growth changes are best viewed by comparing the Target Balance Assumptions reports for the test periods.
Reports
Let’s now look at the reports in IRR2 designed to assist you with your analysis.
Back Testing Financial Statement Variance
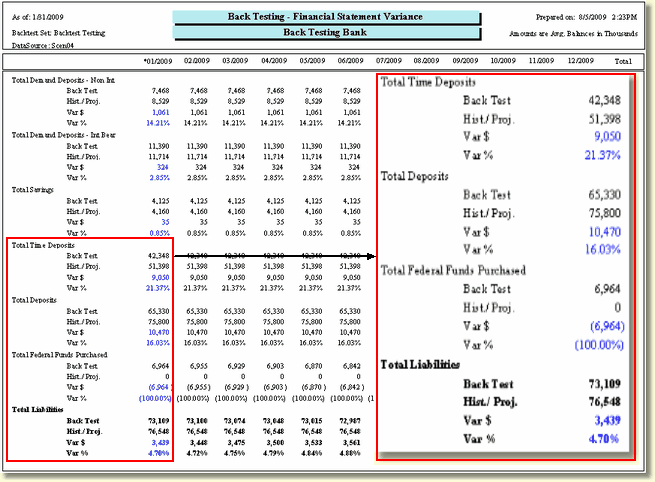
Here’s the Back Test Financial Statement Variance. Our example is testing the results in the January timeframe. In this example we see that our projections at the time the back test set was saved estimated Total Time deposits to be at 42,348,000 but in reality, there was 51,398,000
Looking at our previous log, this may be due to the rush for customers to get the CD special before it was no longer offered. We thought we would be in a fed funds purchased position but we really didn’t have to get alternate funding in January. We may revise projections based on anticipated CD specials in the future based on these results.
Back Testing Yield Variance
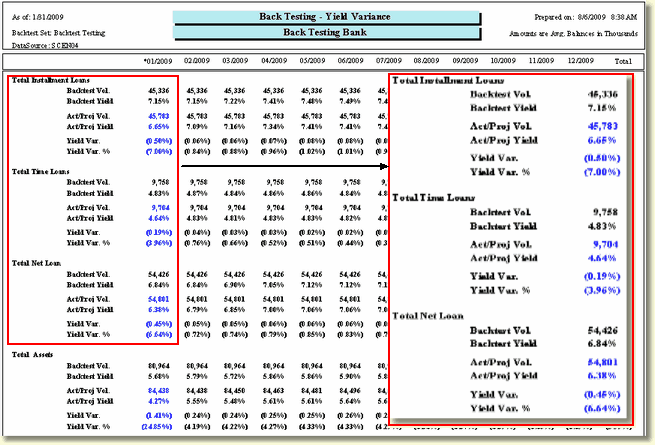
Loan volumes are up from projections but yield is down. Maybe we should look at the New Loans by Officer report to see the rates being applied to new loans in January.
Looking at the log, there is a new loan officer (maybe he/she is aggressive which is why volume is up). Or it could be that your assumptions for reinvestment on these loans were higher than the competition and your officers gave competitive loan rates.
Assumption Changes
| • | Assumption Audit Reports |
| o | Target Balances |
| o | Institution Index Rates |
| o | Reinvestment Assumption Audit |
| o | Prepayment Assumption Audit |
| • | Compare Back Test Save Month to Current |
Assumptions in the model should be compared to determine the differences. Assumption reports have always been available in the model and include the reports for growth (target balance), index rates, reinvestment rates, and prepayment rates.
| • | Variety of Changes Due to Assumption Options |
| o | Branch Assumptions |
| o | By Type Assumptions |
| o | By Item Assumptions |
| o | Assumptions at Varying Levels in the Chart of Accounts |
| o | Index Rate Assumptions (spreads, volatility, values) |
| o | New Effective Rates for Index Rates |
| o | Growth Assumption Methodologies |
Due to the complexity associated with assumption changes (how they are distributed, and combinations of branch, type, item assumptions that can be placed in the model), the best way to compare how assumptions have changed, is to compare the assumption report from the starting month to the ending month’s assumption report.
PDF Files
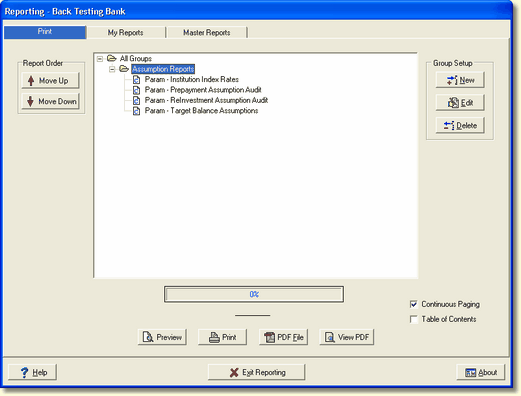
It is recommended that you create PDF copies of assumption reports for every month of the test. You can create a report group to easily archive these each month so they are available for comparison.
Red Flags
| • | Significant Changes in Net Interest Income |
| • | Major Fluctuation in Fed Funds Position |
| • | Variances that Negatively Affect the Bank |
Monitoring these items may raise red flags. You will need to watch for the changes and be ready to account for the reasons why a variance occurred.
Documentation
| • | Memo to Management to Summarize Analysis |
| • | Record of Your Review for Examiners |
Include:
| o | Overview of General Procedures |
| o | Reasons for Choosing Procedures |
| o | Dates & Results |
| o | Action Plan |
| • | "Corporate Memory" |
As a final part of the process, we suggest that you document your variances, conclusions and action plan in a memo to management. This record of your review will be a document which can be shown to examiners, illustrating to them that you have performed the back-testing and have reviewed the results, along with recommendations for your actions based on the results.
The documentation is also an official corporate recording of what transpired, so that you do not have to rely on memory, or have the results “lost” with personnel changes.
Suggestions
| • | Make it a Habit to Perform Back Tests on a Scheduled Basis |
| • | Keep a Log of Events that Happen During the Back Test Period |
| • | Set up a Report Group for the Needed Reports |
Prepare Now for the Future
To help you put this all together, here are some suggestions:
| • | Make it a habit to perform back tests on a scheduled basis. |
| • | Don’t rely on memory to try to remember the events that trigger fluctuations or variances. Keep a log, even of minor events, to see how they may influence your results. |
| • | You can even set up a report group in the Reporting module to print/archive all needed reports. |
| • | Start preparing now for future back-testing. All the preparation is needed now for that future evaluation. |