![]() Main Menu | Reporting | My Reports | Select Group Filer (Advanced Inc. Shock) and Edit
Main Menu | Reporting | My Reports | Select Group Filer (Advanced Inc. Shock) and Edit
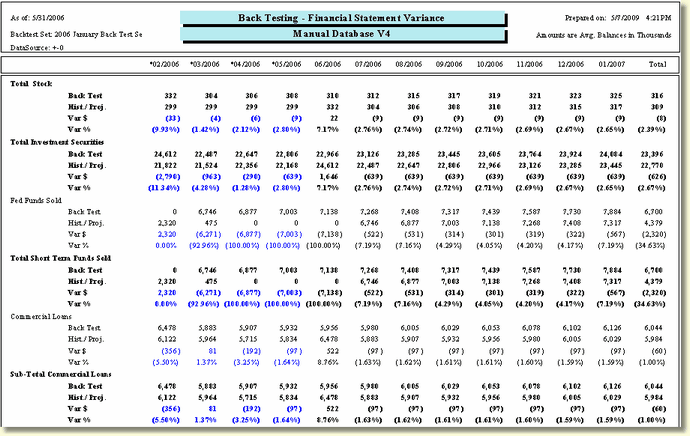
The Back Testing Financial Statement Variance report provides back test comparison data. The comparison is between the selected default Back Test set and Historical and Current Projections. The report is based on the Chart of Accounts and will show all historical months in blue and for non-color printers with an asterisk-* in the date column headers. Reports can be configured for each of the seven shock scenarios; by default the ±0 is setup in the model. Also, Average / Ending balances can be selected.
The following screen displays the system parameters that can be customized by the bank.
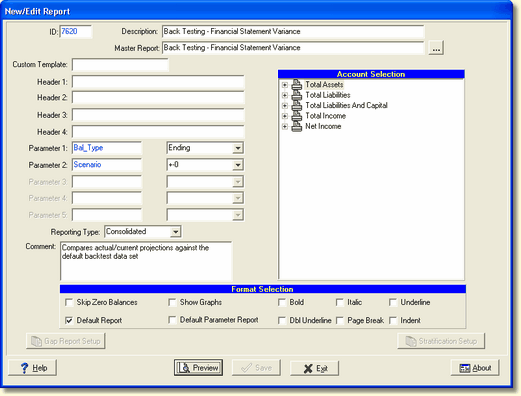
There are two system parameters for this report which can be changed by the user:
Parameter 1: Bal_Type - Select Average(Avg.) or Ending(End.). This parameter pertains to the balance sheet side of the General Ledger. The Income side will always use ending balances. The report will print which balance type you have selected in the upper right hand area, below the date columns.
Parameter 2: Scenario - The default scenario is +-0. Seven shock scenarios are available. If you change this parameter, you may need to change the header to show the appropriate scenario you're using. The report also displays the data source in the upper left hand corner which shows the scenario used for the report.
Calculations
Balance Sheet Accounts:
| • | Date columns contain respective month's Average Monthly Balances for the account (AVG) or Ending Monthly Balances (END) |
| • | Data is displayed in thousands of dollars. |
| • | The Total column is the average for the 12 months shown |
Income Statement Accounts:
| • | Date columns contain respective month's Ending Monthly Balances for the account |
| • | Data is displayed in dollars. |
| • | The Total column is the summation of the 12 months shown |