![]() Main Menu | Reporting | My Reports | Select Report (Advanced EVE group) and Edit
Main Menu | Reporting | My Reports | Select Report (Advanced EVE group) and Edit
The Advanced EVE Summary report provides a summary valuation at the level of total assets, total liabilities, and total equity under the various shock scenarios. In this way, one can see the projected impact of the rate shocks on the overall value of the institution. An example of the Advanced EVE Summary report is shown below.
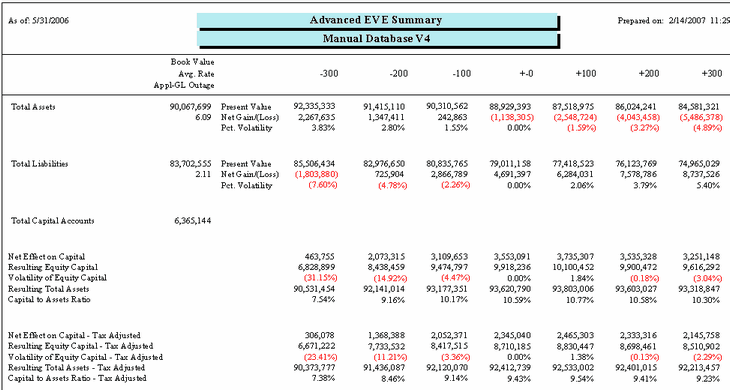
The book values and average rates for total assets, total liabilities, and total capital are shown in the left-hand column. Reading across the page, the Present Value of those total assets and total liabilities are shown under the appropriate rate shocks. Those present values represents the sum total of present values for each asset and liability item under each of the appropriate rate shocks.
NOTE: If you have excluded EVE accounts (Goodwill), those volumes will not be included in the Book Value totals. Excluded accounts do not produce a present value. Those accounts will display all zeros on the report.
The Net Gain/(Loss) shown under the Present Value represents the difference between the Present Value and the original book value seen in the left-hand column. The Pct. Volatility represents the percentage change between the Present Value under each of the shock scenarios and the Present Value in the "no change" (+/- 0) scenario.
Since our main purpose is to determine the impact of changes in rates on the value of the institution's equity, much of the data in this summary is devoted to an analysis of the effects of these calculations on the institution's equity.
Reading across the page below the book value of total equity, we see the Net Effect on Capital under each of the shock scenarios. This Net Effect is simply the sum of the Net Gain/(Loss) for Total Assets and Total Liabilities under the appropriate shock scenario. Because capital represents the difference between the value of institution's assets and the value of its liabilities, changes in the values of assets and liabilities should also impact capital. The Resulting Equity Capital is simply that Net Effect on Capital under each shock scenario added to the book value of Total Capital.
Below the Resulting Equity Capital, we see the Volatility of Equity Capital. This figure represents the percentage change between the Resulting Equity Capital under each of the shock scenarios and the Resulting Equity Capital in the "no change" (+/- 0) scenario.
Below that, the Resulting Total Assets represents the book value of Total Assets adjusted for the Net Effect on Capital and, below that, the Capital to Assets Ratio is the ratio of Resulting Equity Capital to Resulting Total Assets.
The bottom set of numbers in this report take these items and adjust them as if the Net Effect on Capital was being recognized as ordinary taxable income.